Plot steel and reinforced concrete fiber sections
Example .py file can be downloaded here:
1import openseespy.opensees as ops
2# import opensees as ops # local compilation
3import opsvis as opsv
4
5import matplotlib.pyplot as plt
6
7ops.wipe()
8ops.model('basic', '-ndm', 2, '-ndf', 3) # frame 2D
9
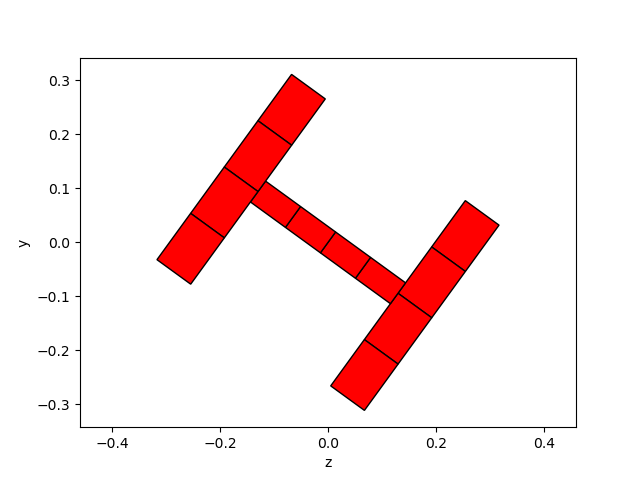
10# 1. rotated steel shape
11
12fib_sec_1 = [['section', 'Fiber', 1, '-GJ', 1.0e6],
13 ['patch', 'quad', 1, 4, 1, 0.032, 0.317, -0.311, 0.067, -0.266, 0.005, 0.077, 0.254],
14 ['patch', 'quad', 1, 1, 4, -0.075, 0.144, -0.114, 0.116, 0.075, -0.144, 0.114, -0.116],
15 ['patch', 'quad', 1, 4, 1, 0.266, -0.005, -0.077, -0.254, -0.032, -0.317, 0.311, -0.067]
16 ]
17
18# fib_sec_1 list can be used both for plotting and OpenSees commands defining
19# the actual fiber section in the OpenSees domain. Normally you would have to
20# use regular section('Fiber', ...), fiber(), layer(), patch() commands with
21# the same data to define the fiber section. However do not use both
22# ways in the same model.
23
24# opsv.fib_sec_list_to_cmds(fib_sec_1)
25
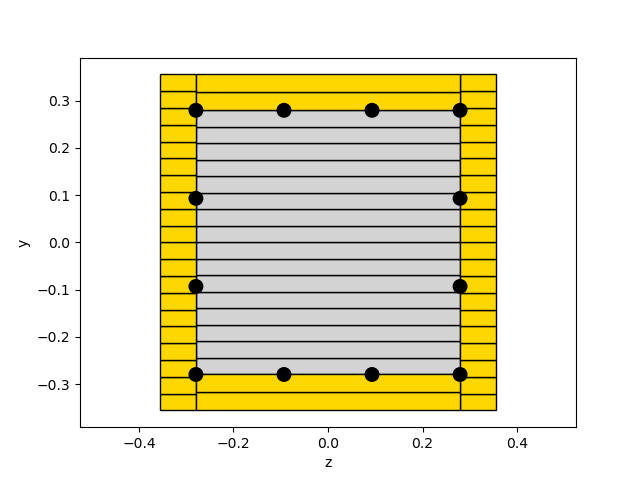
26# 2. RC section
27
28Bcol = 0.711
29Hcol = Bcol
30
31c = 0.076 # cover
32
33y1col = Hcol/2.0
34z1col = Bcol/2.0
35
36y2col = 0.5*(Hcol-2*c)/3.0
37
38nFibZ = 1
39nFib = 20
40nFibCover, nFibCore = 2, 16
41As9 = 0.0006446
42
43fib_sec_2 = [['section', 'Fiber', 3, '-GJ', 1.0e6],
44 ['patch', 'rect', 2, nFibCore, nFibZ, c-y1col, c-z1col, y1col-c, z1col-c],
45 ['patch', 'rect', 3, nFib, nFibZ, -y1col, -z1col, y1col, c-z1col],
46 ['patch', 'rect', 3, nFib, nFibZ, -y1col, z1col-c, y1col, z1col],
47 ['patch', 'rect', 3, nFibCover, nFibZ, -y1col, c-z1col, c-y1col, z1col-c],
48 ['patch', 'rect', 3, nFibCover, nFibZ, y1col-c, c-z1col, y1col, z1col-c],
49 ['layer', 'straight', 4, 4, As9, y1col-c, z1col-c, y1col-c, c-z1col],
50 ['layer', 'straight', 4, 2, As9, y2col, z1col-c, y2col, c-z1col],
51 ['layer', 'straight', 4, 2, As9, -y2col, z1col-c, -y2col, c-z1col],
52 ['layer', 'straight', 4, 4, As9, c-y1col, z1col-c, c-y1col, c-z1col]]
53
54
55# opsv.fib_sec_list_to_cmds(fib_sec_2)
56
57matcolor = ['r', 'lightgrey', 'gold', 'w', 'w', 'w']
58opsv.plot_fiber_section(fib_sec_1, matcolor=matcolor)
59plt.axis('equal')
60# plt.savefig('fibsec_wshape.png')
61
62matcolor = ['r', 'lightgrey', 'gold', 'w', 'w', 'w']
63opsv.plot_fiber_section(fib_sec_2, matcolor=matcolor)
64plt.axis('equal')
65# plt.savefig('fibsec_rc.png')
66
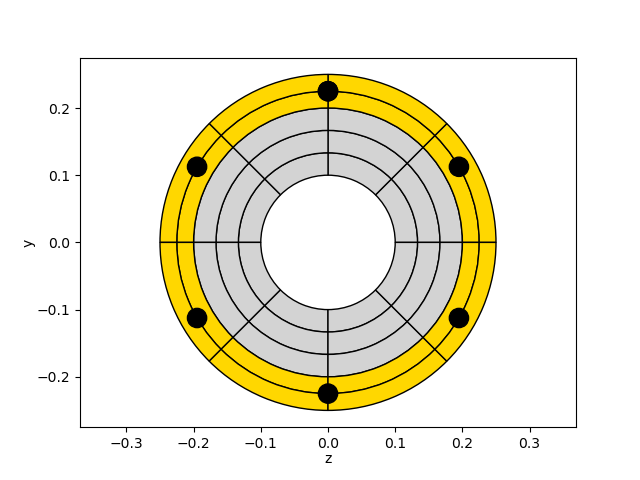
67# 3. circular cross-section
68nc1, nr1 = 8, 3
69nc2, nr2 = 8, 2
70ri1, re1 = 0.1, 0.2
71ri2, re2 = 0.2, 0.25
72a_beg, a_end = 0., 360.
73rbar3 = 0.225
74a_beg2, a_end2 = 0., 360.
75
76fib_sec_3 = [['section', 'Fiber', 1, '-GJ', 1.0e6],
77 ['patch', 'circ', 2, nc1, nr1, 0., 0., ri1, re1, a_beg, a_end],
78 ['patch', 'circ', 3, nc2, nr2, 0., 0., ri2, re2, a_beg, a_end],
79 ['layer', 'circ', 4, 6, As9, 0., 0., rbar3, a_beg2, a_end2],
80 ]
81
82
83matcolor = ['r', 'lightgrey', 'gold', 'w', 'w', 'w']
84opsv.plot_fiber_section(fib_sec_3, matcolor=matcolor)
85plt.axis('equal')
86# plt.savefig('fibsec_circ.png')
87
88plt.show()