Statics of a 3d 3-element cantilever beam
Example .py file can be downloaded here:
1import openseespy.opensees as ops
2import opsvis as opsv
3
4import matplotlib.pyplot as plt
5
6ops.wipe()
7
8ops.model('basic', '-ndm', 3, '-ndf', 6)
9
10b = 0.2
11h = 0.4
12
13A, Iz, Iy, J = 0.04, 0.0010667, 0.0002667, 0.01172
14
15E = 25.0e6
16G = 9615384.6
17
18# Lx, Ly, Lz = 4., 3., 5.
19Lx, Ly, Lz = 4., 4., 4.
20
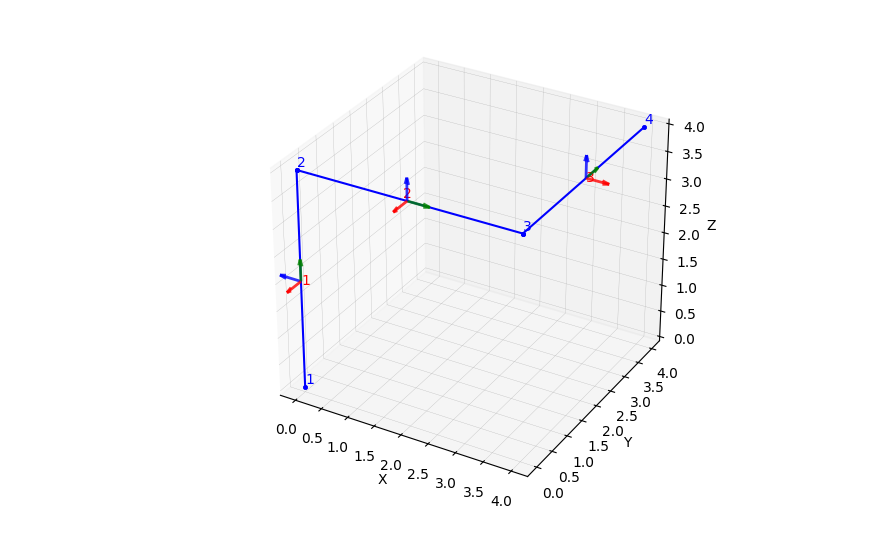
21ops.node(1, 0., 0., 0.)
22ops.node(2, 0., 0., Lz)
23ops.node(3, Lx, 0., Lz)
24ops.node(4, Lx, Ly, Lz)
25
26ops.fix(1, 1, 1, 1, 1, 1, 1)
27
28lmass = 200.
29
30ops.mass(2, lmass, lmass, lmass, 0.001, 0.001, 0.001)
31ops.mass(3, lmass, lmass, lmass, 0.001, 0.001, 0.001)
32ops.mass(4, lmass, lmass, lmass, 0.001, 0.001, 0.001)
33
34gTTagz = 1
35gTTagx = 2
36gTTagy = 3
37
38coordTransf = 'Linear'
39ops.geomTransf(coordTransf, gTTagz, 0., -1., 0.)
40ops.geomTransf(coordTransf, gTTagx, 0., -1., 0.)
41ops.geomTransf(coordTransf, gTTagy, 1., 0., 0.)
42
43ops.element('elasticBeamColumn', 1, 1, 2, A, E, G, J, Iy, Iz, gTTagz)
44ops.element('elasticBeamColumn', 2, 2, 3, A, E, G, J, Iy, Iz, gTTagx)
45ops.element('elasticBeamColumn', 3, 3, 4, A, E, G, J, Iy, Iz, gTTagy)
46
47Ew = {}
48
49Px = -4.e1
50Py = -2.5e1
51Pz = -3.e1
52
53ops.timeSeries('Constant', 1)
54ops.pattern('Plain', 1, 1)
55ops.load(4, Px, Py, Pz, 0., 0., 0.)
56
57ops.constraints('Transformation')
58ops.numberer('RCM')
59ops.system('BandGeneral')
60ops.test('NormDispIncr', 1.0e-6, 6, 2)
61ops.algorithm('Linear')
62ops.integrator('LoadControl', 1)
63ops.analysis('Static')
64ops.analyze(1)
65
66
67opsv.plot_model()
68
69sfac = 2.0e0
70
71# fig_wi_he = 22., 14.
72fig_wi_he = 30., 20.
73
74# - 1
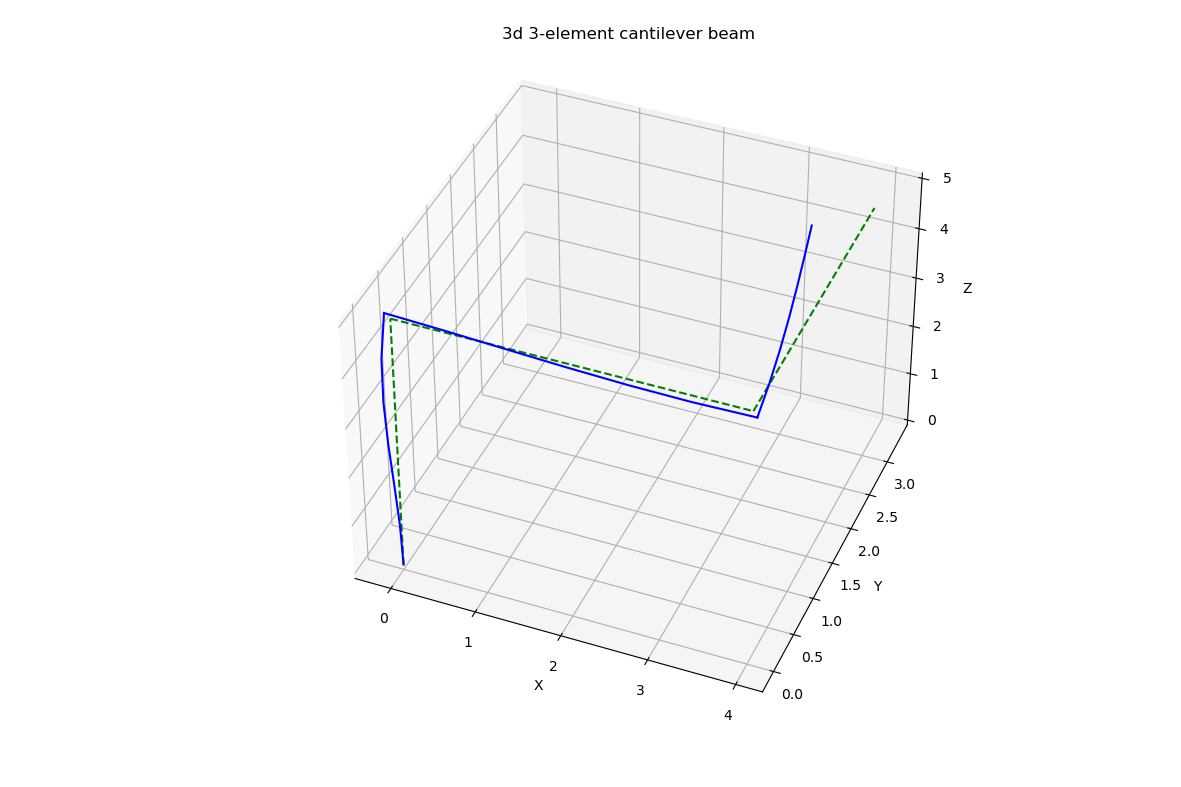
75nep = 9
76opsv.plot_defo(sfac, nep, az_el=(-68., 39.),
77 fig_wi_he=fig_wi_he, endDispFlag=0)
78
79plt.title('3d 3-element cantilever beam')
80
81# - 2
82opsv.plot_defo(sfac, 19, az_el=(6., 30.), fig_wi_he=fig_wi_he)
83
84plt.title('3d 3-element cantilever beam')
85
86# - 3
87nfreq = 6
88eigValues = ops.eigen(nfreq)
89
90modeNo = 6
91
92sfac = 2.0e1
93opsv.plot_mode_shape(modeNo, sfac, 19, az_el=(106., 46.),
94 fig_wi_he=fig_wi_he)
95plt.title(f'Mode {modeNo}')
96
97sfacN = 1.e-2
98sfacVy = 5.e-2
99sfacVz = 1.e-2
100sfacMy = 1.e-2
101sfacMz = 1.e-2
102sfacT = 1.e-2
103
104# plt.figure()
105opsv.section_force_diagram_3d('N', sfacN)
106plt.title('Axial force N')
107
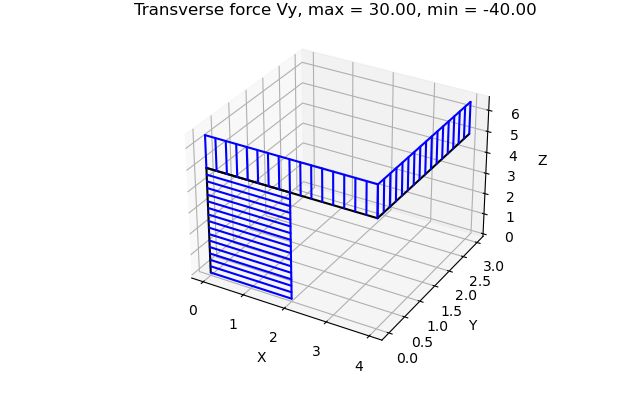
108opsv.section_force_diagram_3d('Vy', sfacVy)
109plt.title('Transverse force Vy')
110
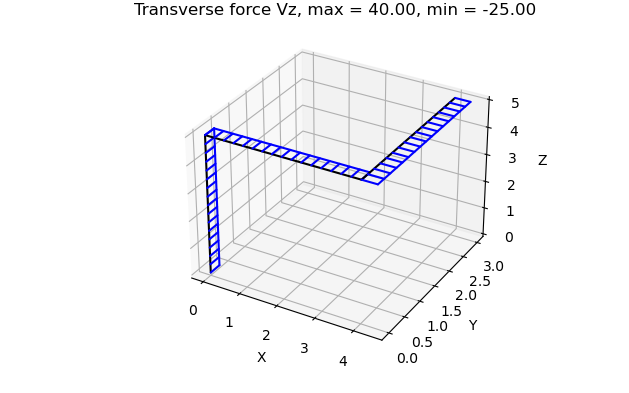
111opsv.section_force_diagram_3d('Vz', sfacVz)
112plt.title('Transverse force Vz')
113
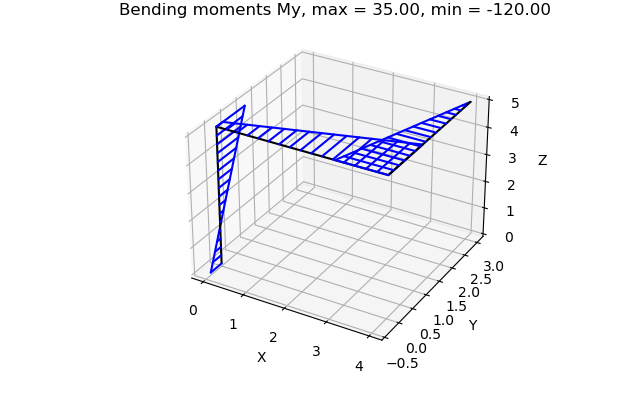
114opsv.section_force_diagram_3d('My', sfacMy)
115plt.title('Bending moments My')
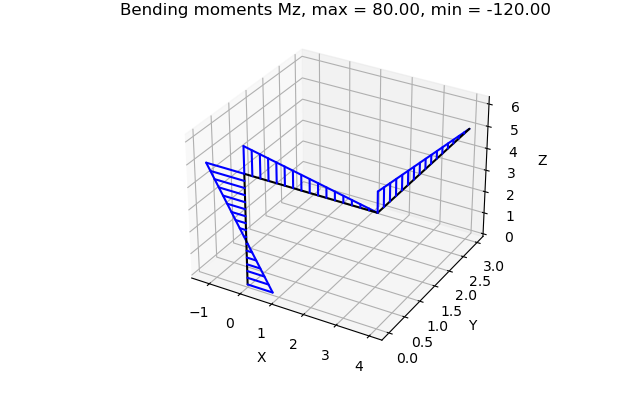
116
117opsv.section_force_diagram_3d('Mz', sfacMz)
118plt.title('Bending moments Mz')
119
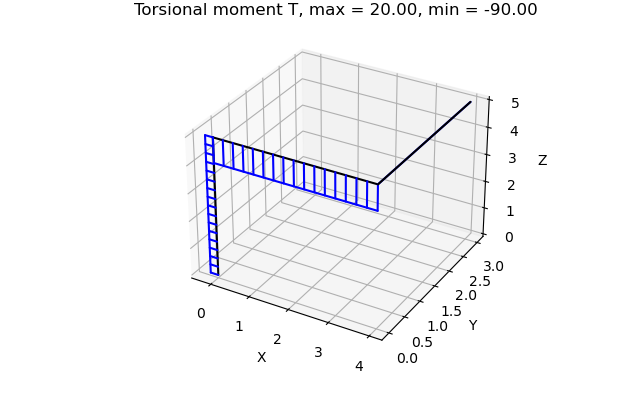
120opsv.section_force_diagram_3d('T', sfacT)
121plt.title('Torsional moment T')
122
123# just for demonstration,
124# the section data below does not match the data in OpenSees model above
125# For now it can be source of inconsistency because OpenSees has
126# not got functions to return section dimensions.
127# A workaround is to have own Python helper functions to reuse data
128# specified once
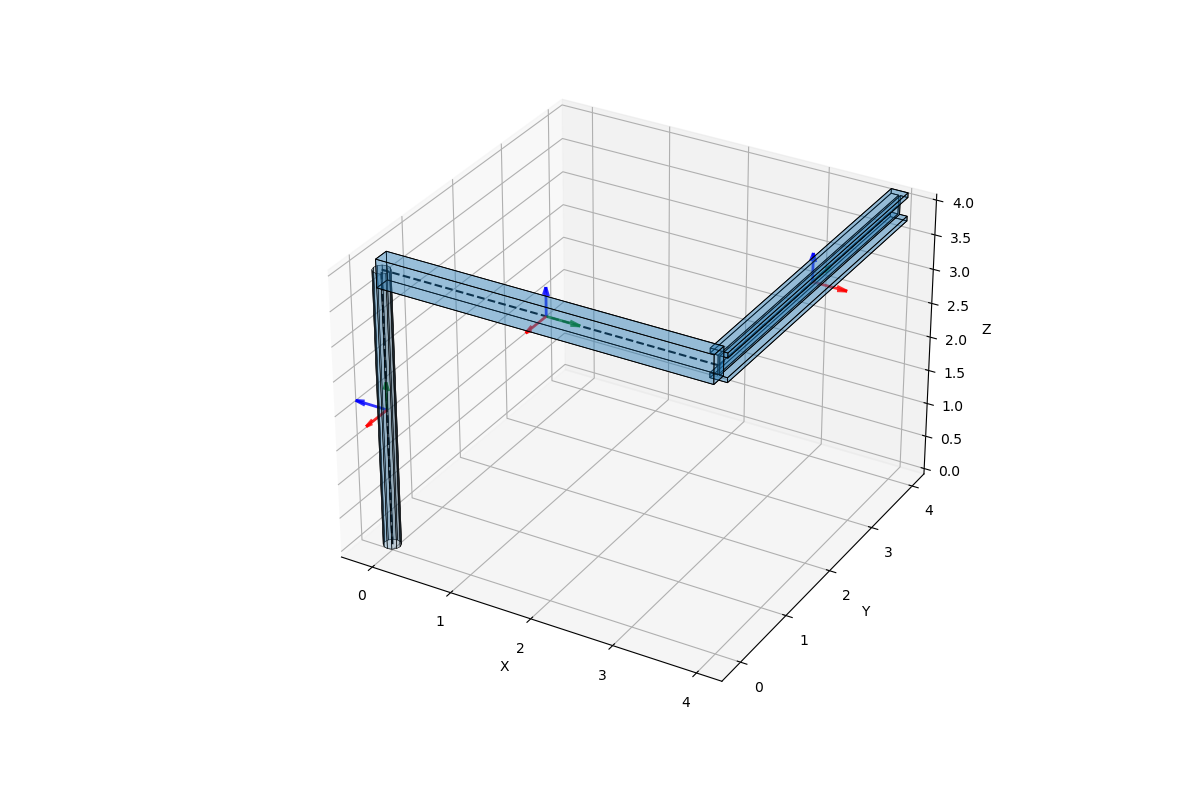
129ele_shapes = {1: ['circ', [h]],
130 2: ['rect', [b, h]],
131 3: ['I', [b, h, b/10., h/6.]]}
132opsv.plot_extruded_shapes_3d(ele_shapes, fig_wi_he=fig_wi_he)
133
134plt.show()
135
136exit()