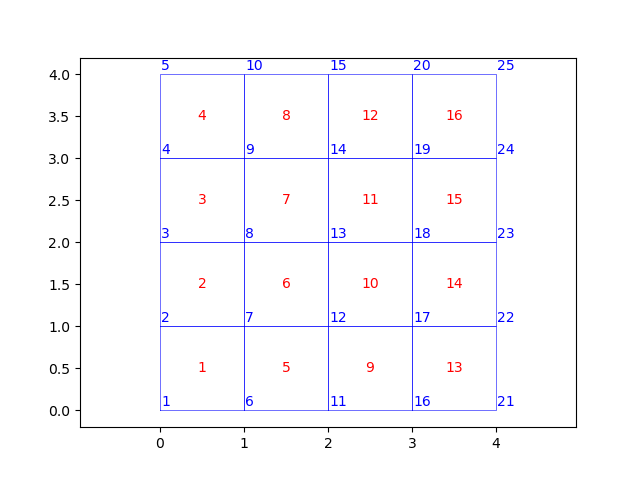
Plot stress distribution of a plane stress quad model
Example .py file can be downloaded here:
1import openseespy.opensees as ops
2import opsvis as opsv
3
4import matplotlib.pyplot as plt
5
6ops.wipe()
7ops.model('basic', '-ndm', 2, '-ndf', 2)
8ops.node(1, 0., 0.)
9ops.node(2, 0., 1.)
10ops.node(3, 0., 2.)
11ops.node(4, 0., 3.)
12ops.node(5, 0., 4.)
13ops.node(6, 1., 0.)
14ops.node(7, 1., 1.)
15ops.node(8, 1., 2.)
16ops.node(9, 1., 3.)
17ops.node(10, 1., 4.)
18ops.node(11, 2., 0.)
19ops.node(12, 2., 1.)
20ops.node(13, 2., 2.)
21ops.node(14, 2., 3.)
22ops.node(15, 2., 4.)
23ops.node(16, 3., 0.)
24ops.node(17, 3., 1.)
25ops.node(18, 3., 2.)
26ops.node(19, 3., 3.)
27ops.node(20, 3., 4.)
28ops.node(21, 4., 0.)
29ops.node(22, 4., 1.)
30ops.node(23, 4., 2.)
31ops.node(24, 4., 3.)
32ops.node(25, 4., 4.)
33
34ops.nDMaterial('ElasticIsotropic', 1, 1000, 0.3)
35
36ops.element('quad', 1, 1, 6, 7, 2, 1, 'PlaneStress', 1)
37ops.element('quad', 2, 2, 7, 8, 3, 1, 'PlaneStress', 1)
38ops.element('quad', 3, 3, 8, 9, 4, 1, 'PlaneStress', 1)
39ops.element('quad', 4, 4, 9, 10, 5, 1, 'PlaneStress', 1)
40ops.element('quad', 5, 6, 11, 12, 7, 1, 'PlaneStress', 1)
41ops.element('quad', 6, 7, 12, 13, 8, 1, 'PlaneStress', 1)
42ops.element('quad', 7, 8, 13, 14, 9, 1, 'PlaneStress', 1)
43ops.element('quad', 8, 9, 14, 15, 10, 1, 'PlaneStress', 1)
44ops.element('quad', 9, 11, 16, 17, 12, 1, 'PlaneStress', 1)
45ops.element('quad', 10, 12, 17, 18, 13, 1, 'PlaneStress', 1)
46ops.element('quad', 11, 13, 18, 19, 14, 1, 'PlaneStress', 1)
47ops.element('quad', 12, 14, 19, 20, 15, 1, 'PlaneStress', 1)
48ops.element('quad', 13, 16, 21, 22, 17, 1, 'PlaneStress', 1)
49ops.element('quad', 14, 17, 22, 23, 18, 1, 'PlaneStress', 1)
50ops.element('quad', 15, 18, 23, 24, 19, 1, 'PlaneStress', 1)
51ops.element('quad', 16, 19, 24, 25, 20, 1, 'PlaneStress', 1)
52
53ops.fix(1, 1, 1)
54ops.fix(6, 1, 1)
55ops.fix(11, 1, 1)
56ops.fix(16, 1, 1)
57ops.fix(21, 1, 1)
58
59ops.equalDOF(2, 22, 1, 2)
60ops.equalDOF(3, 23, 1, 2)
61ops.equalDOF(4, 24, 1, 2)
62ops.equalDOF(5, 25, 1, 2)
63
64ops.timeSeries('Linear', 1)
65ops.pattern('Plain', 1, 1)
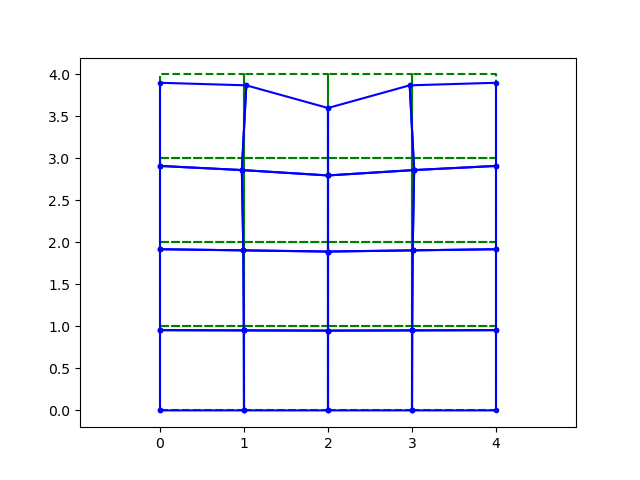
66ops.load(15, 0., -1.)
67
68ops.analysis('Static')
69ops.analyze(1)
70
71# - plot model
72opsv.plot_model()
73plt.axis('equal')
74
75# plt.figure()
76opsv.plot_load()
77
78# - plot deformation
79opsv.plot_defo(unDefoFlag=1)
80plt.axis('equal')
81
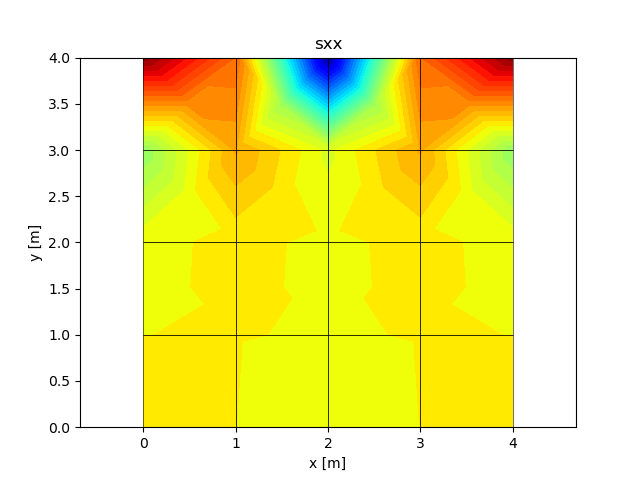
82jstr = 'sxx'
83plt.figure()
84opsv.plot_stress(jstr)
85plt.xlabel('x [m]')
86plt.ylabel('y [m]')
87plt.title(f'{jstr}')
88
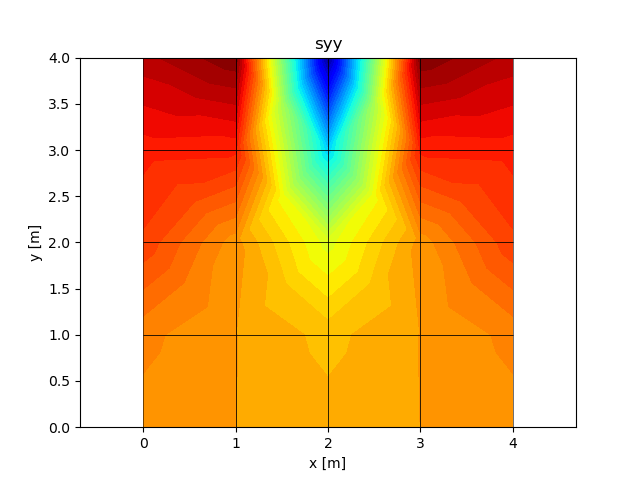
89jstr = 'syy'
90plt.figure()
91opsv.plot_stress(jstr)
92plt.xlabel('x [m]')
93plt.ylabel('y [m]')
94plt.title(f'{jstr}')
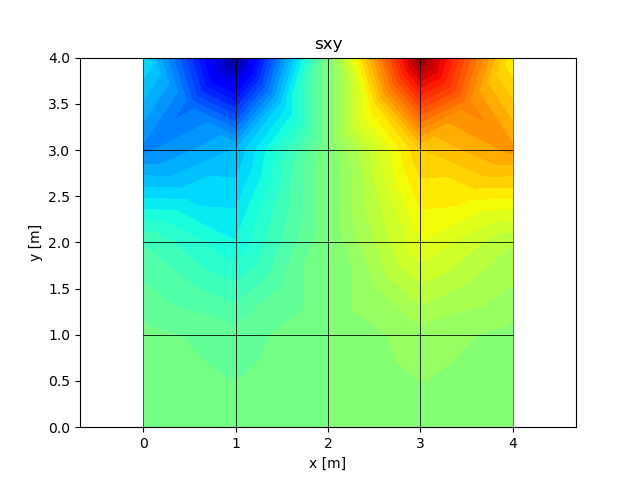
95
96jstr = 'sxy'
97plt.figure()
98opsv.plot_stress(jstr)
99plt.xlabel('x [m]')
100plt.ylabel('y [m]')
101plt.title(f'{jstr}')
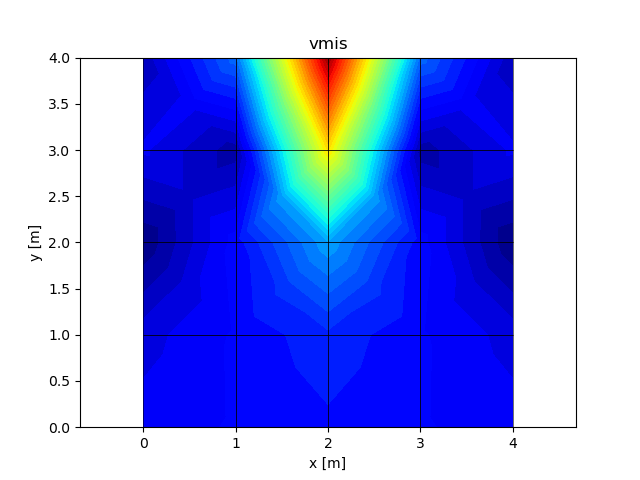
102
103jstr = 'vmis'
104plt.figure()
105opsv.plot_stress(jstr)
106plt.xlabel('x [m]')
107plt.ylabel('y [m]')
108plt.title(f'{jstr}')
109
110
111jstr = 'exx'
112plt.figure()
113opsv.plot_strain(jstr)
114plt.xlabel('x [m]')
115plt.ylabel('y [m]')
116plt.title(f'{jstr}')
117
118jstr = 'eyy'
119plt.figure()
120opsv.plot_strain(jstr)
121plt.xlabel('x [m]')
122plt.ylabel('y [m]')
123plt.title(f'{jstr}')
124
125jstr = 'exy'
126plt.figure()
127opsv.plot_strain(jstr)
128plt.xlabel('x [m]')
129plt.ylabel('y [m]')
130plt.title(f'{jstr}')
131
132plt.show()
133
134exit()